
Jira Service Management Cloud · SLA reporting
How to Build an SLA Report by Customer Organization in Jira Service Management
Create a custom report with one Time to resolution - % Met series per customer organization, set the month as a Custom range, and check each percentage with two JQL searches before you send it to the client.
 Updated
 9 min read
 Tested in Jira Service Management Cloud on
This guide is for a service manager who sends each customer a monthly SLA report. It uses only what Jira Service Management already has: custom reports, JQL and CSV export. Everything is done by hand in the interface, and the guide shows where that hand work repeats every month.
Short answer
- Open Reports in the service space and create a new report.
- Add one series per organization: Time to resolution - % Met, filtered to that organization.
- Set Custom range to the month you report on.
- Check each percentage with JQL: resolved in the month, and how many of those breached.
- Export CSV and write one short summary per client.
On this page7 sections
The example and the result
The example is a Jira Service Management sample space with three customer organizations: Northstar Services, Cedar & Co. and Willow Group. The month is January 2024 and the SLA is Time to resolution. At the end you have one SLA report with three numbers, and you can prove each of them:
January 2024, Time to resolution
| Customer organization | Resolved | Breached | Met | SLA met |
|---|---|---|---|---|
| Northstar Services | 13 | 3 | 10 | 76.9 % |
| Cedar & Co. | 12 | 5 | 7 | 58.3 % |
| Willow Group | 11 | 3 | 8 | 72.7 % |
The percentages come from the custom report; the counts come from JQL. They match, which is the point of the check in this guide.
Build the report
-
Step 1: Create a custom report
In the service space sidebar, open Reports and select Create new report. Give it a name that says what it compares, for example “SLA met by organization”, then select Add series.
Check: the Edit a series dialog is open.
-
Step 2: Add one series for the first organization
In Series, choose Time to resolution - % Met (the list also has the Avg. and Breached variants for each SLA). Put the organization name in Label. Under Filter by, keep Specific work items and filter by the organization: in Basic mode add Organizations from More filters, or switch to JQL and type:
JQL organizations = "Northstar Services"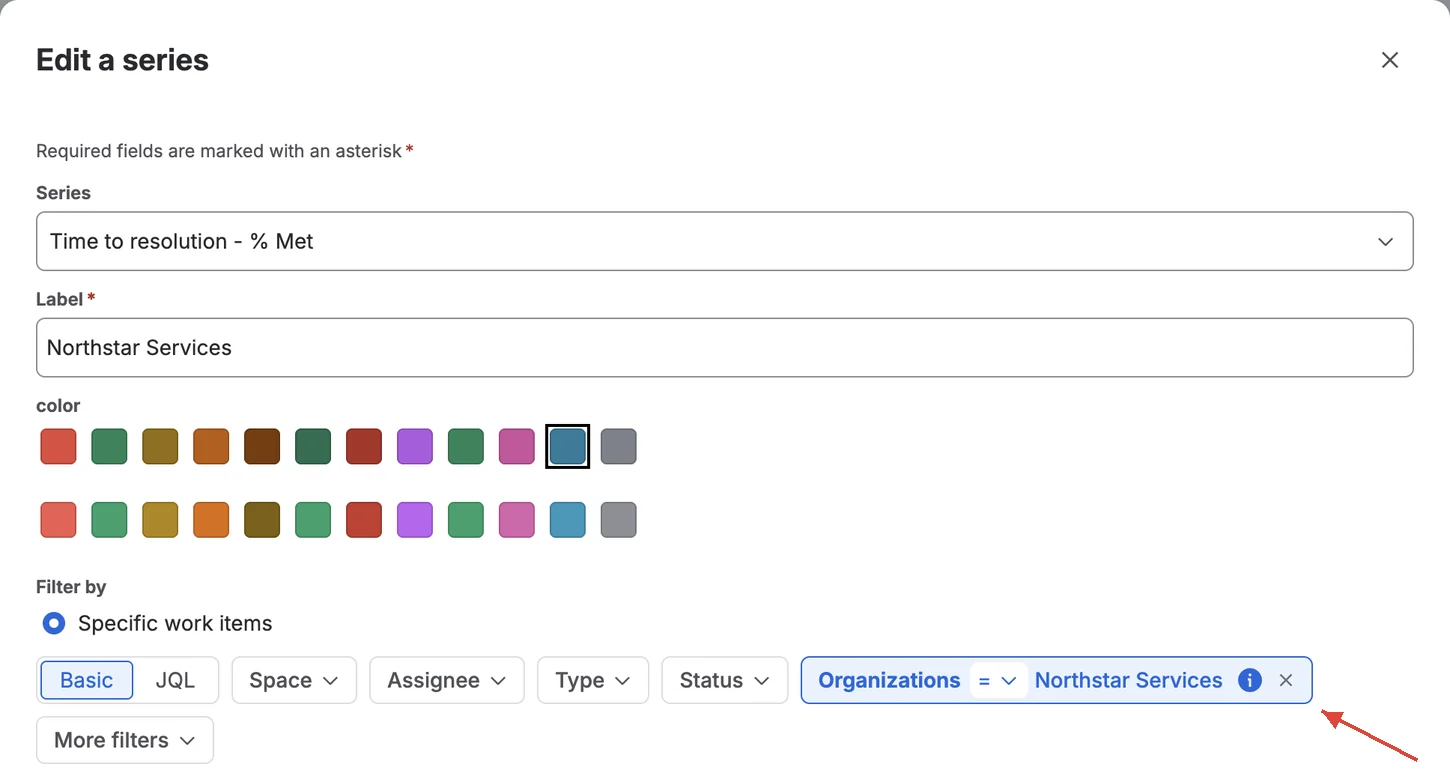 Enlarge screenshot
- Series — the SLA metric. Use the same one for every client.
- Label — the organization name, so the chart and the export are readable.
- The organization filter. Jira showed the JQL from the previous step as a Basic filter after saving.
Check: the report shows a percentage under the organization’s label.
-
Step 3: Repeat for every organization
Add the same series for each client and change only the label and the filter:
organizations = "Cedar & Co.",organizations = "Willow Group". A report holds up to 20 series. Keep one organization per series; a series with several organizations gives one mixed number that belongs to no client.If your agreement has a target, tick Set a target of … % on the report page under the series figures. The target line then appears on the chart.
Check: each organization has its own series, all with the same SLA metric.
-
Step 4: Set the month
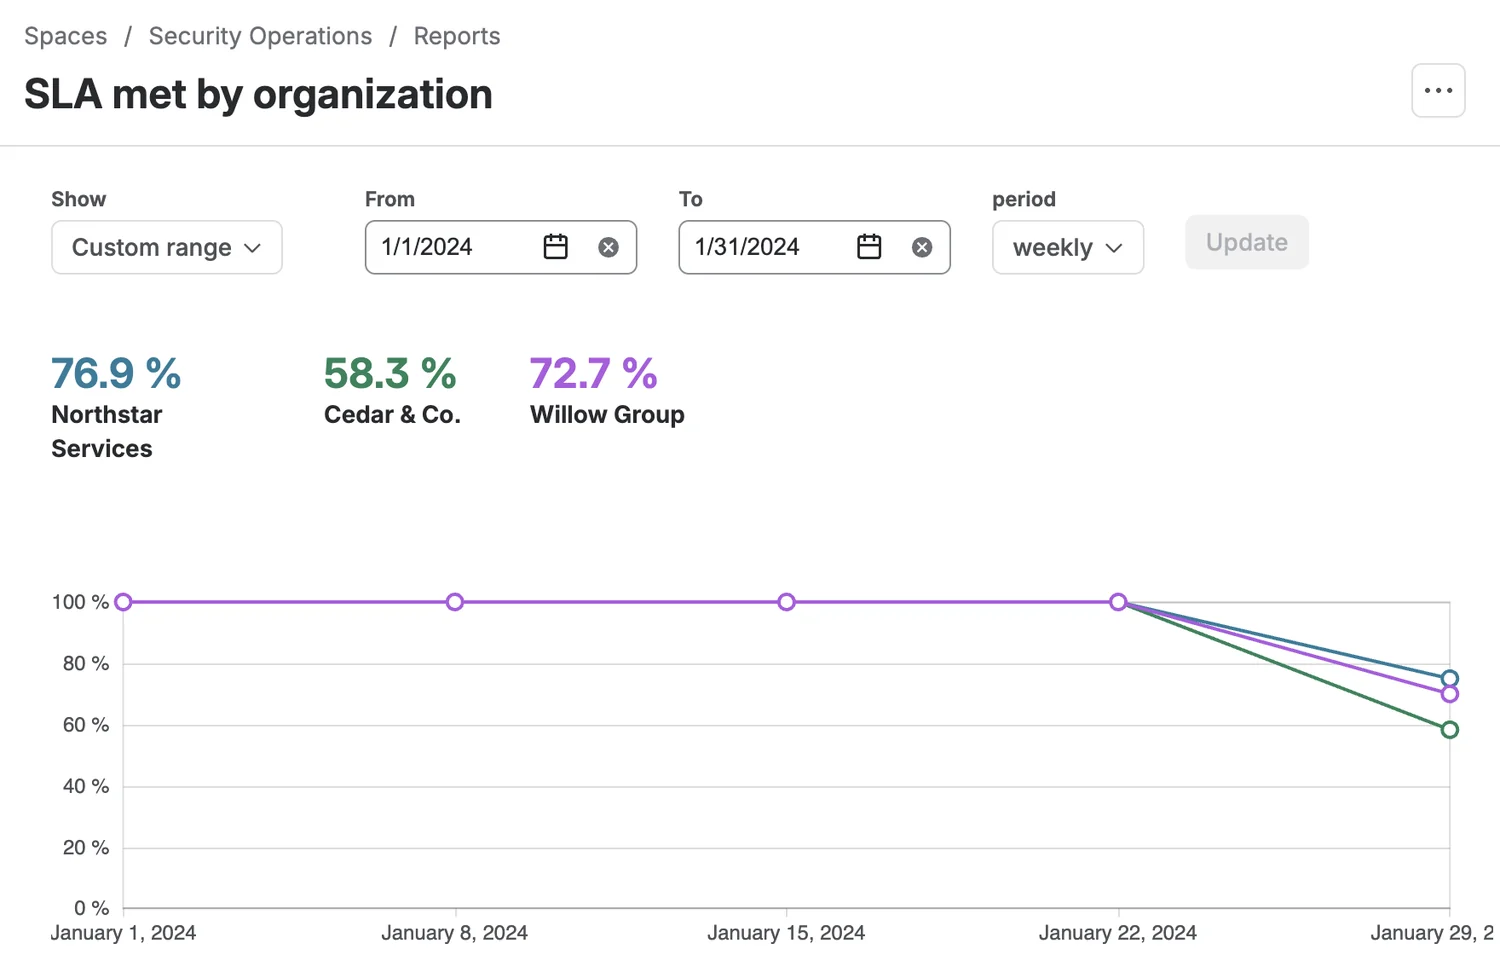
Select Create to save the report. In Show, choose Custom range, set From and To to the first and last day of the month, choose a period (daily or weekly) and select Update. The other choices are rolling windows such as Past 30 days, which do not match a calendar month.
 Enlarge screenshot
- Custom range from 1/1/2024 to 1/31/2024.
- One SLA percentage per organization for the whole range.
Check: the range is the calendar month and every organization has a percentage.
Check each percentage with JQL
Before a number goes to a client, make sure you can show where it comes from. Go to FiltersSearch work items, switch to JQL and count the client’s requests resolved in the month:
project = SECOPS AND organizations = "Northstar Services" AND resolved >= "2024-01-01" AND resolved < "2024-02-01"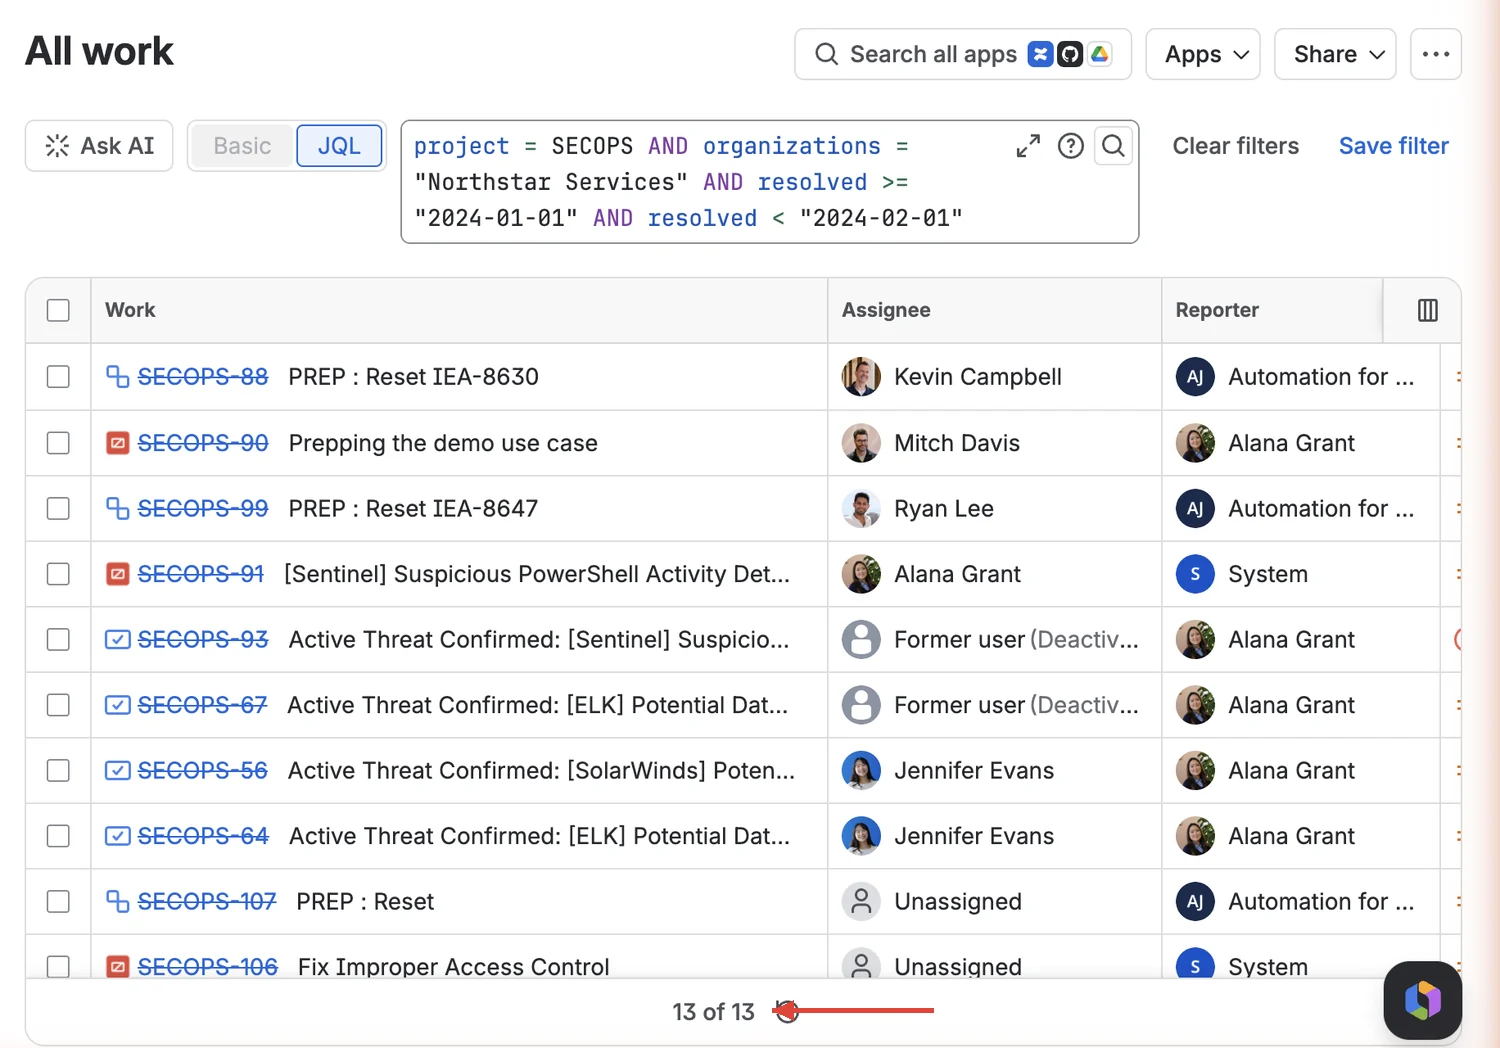 Enlarge screenshot
- The query: one organization, resolved in the month.
- 13 of 13 — the total for this client.
Then add the SLA condition to count the breaches:
project = SECOPS AND organizations = "Northstar Services" AND resolved >= "2024-01-01" AND resolved < "2024-02-01" AND "Time to resolution" = breached()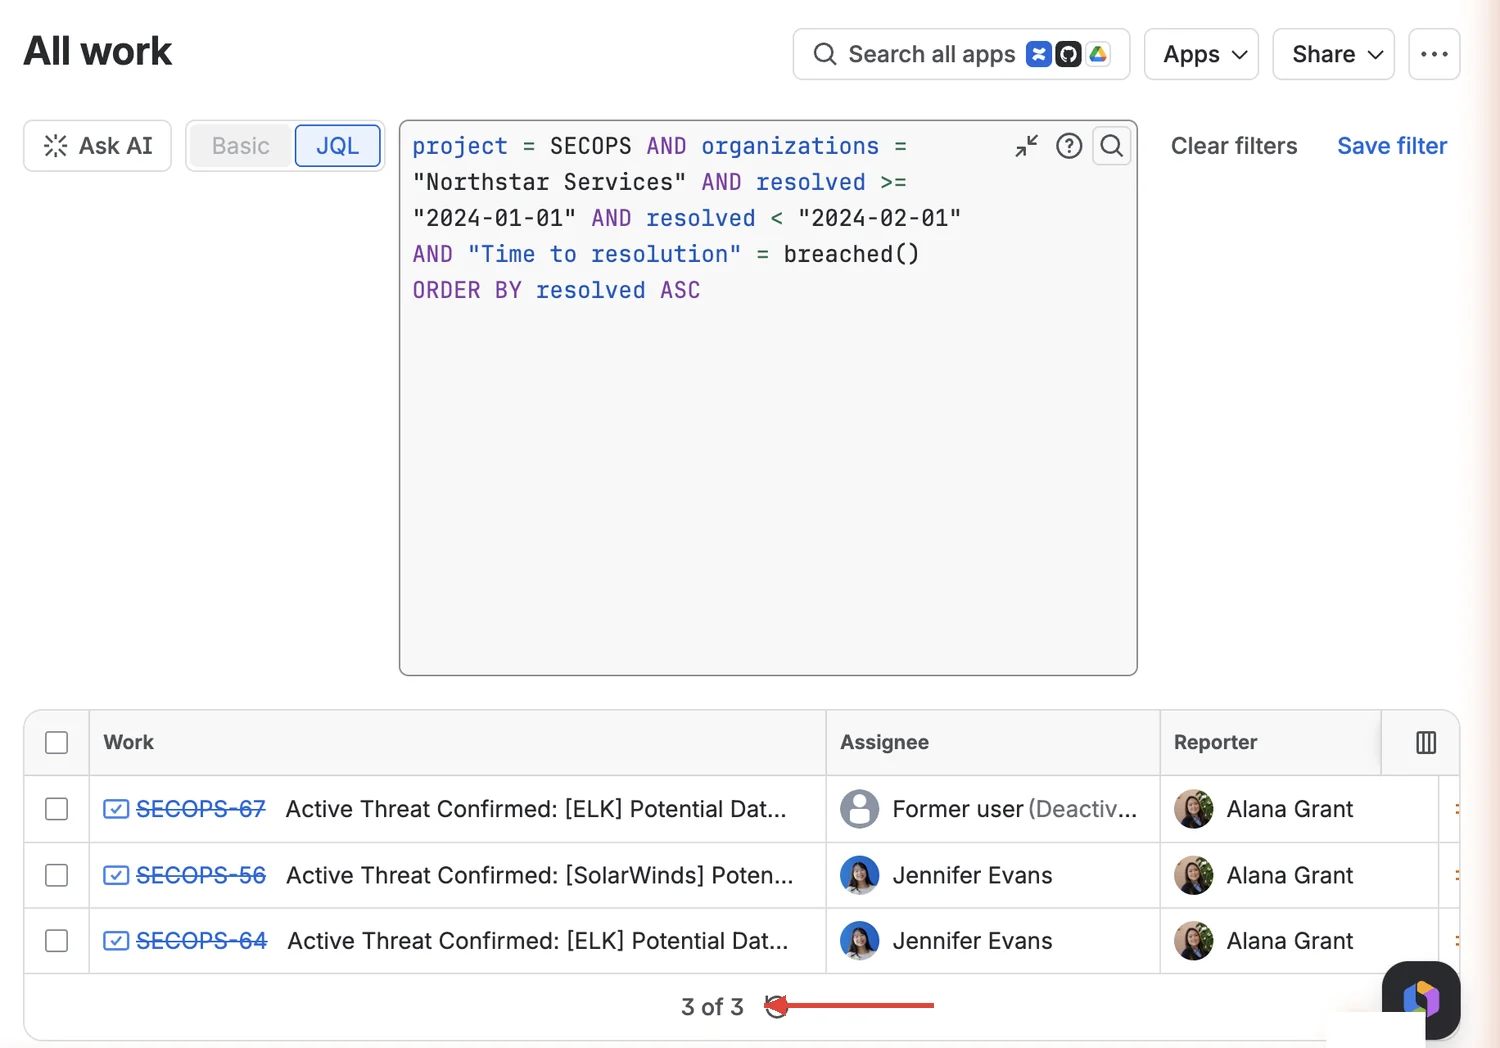 Enlarge screenshot
- The SLA condition:
"Time to resolution" = breached(). - 3 of 3 — breached requests for this client in the month.
13 resolved, 3 breached, so 10 met: 10 ÷ 13 = 76.9 %, the same as the report. breached() returns work items whose most recent SLA cycle missed its goal; completed() returns those whose SLA cycle reached a stop event. Atlassian: Write JQL queries for SLAs
Check: for all three January 2024 clients in this example, met ÷ resolved equals the report’s percentage. On another SLA configuration, verify the population before using the same calculation.
Export the report
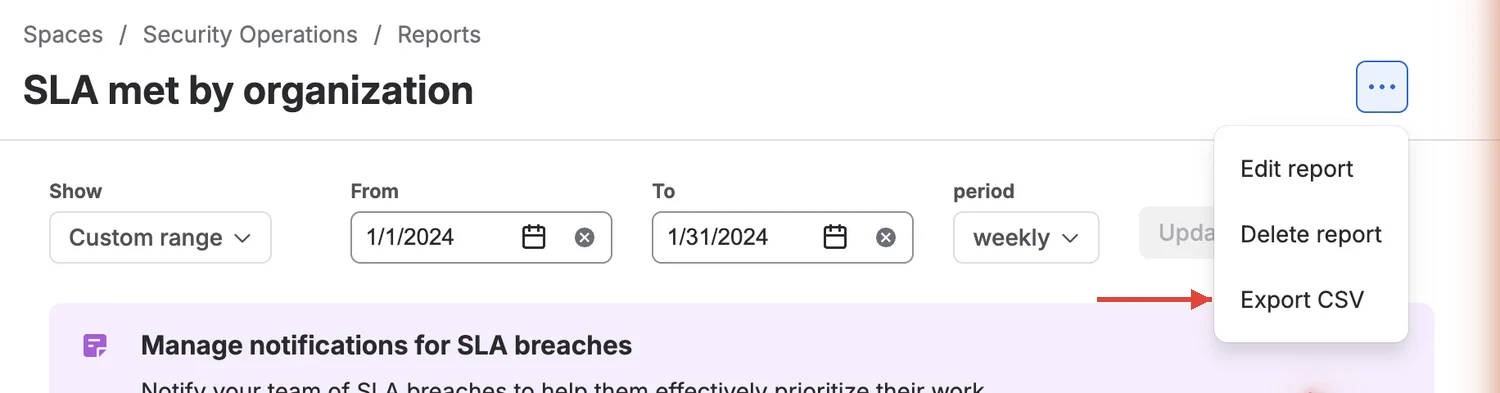
On a custom report, open ⋯ next to the title and select Export CSV (the default reports have an Export CSV button instead). The export takes only the current view, so set the month first. For a list of the requests behind a number, export the JQL search instead: ⋯ExportCSV - all fields.
 Enlarge screenshot
- The report menu.
- Export CSV — the current view of the report.
The file holds every organization in one table. It is your internal record of the month, not something to forward as it is. Atlassian: Create a custom report
What to send the client
A client needs their own number with enough context to understand it, not your all-client chart. For each organization, a monthly SLA report can be a short table:
Monthly SLA report for one client
| Field | Example |
|---|---|
| Customer | Northstar Services |
| Period | 1–31 January 2024 |
| SLA | Time to resolution |
| Target | 80 % (from your agreement) |
| Resolved / met / breached | 13 / 10 / 3 |
| SLA met | 76.9 % |
| Notes | Short explanation of the breaches, if needed |
If the client asks for an SLA compliance report, name the SLA and the period exactly and give the counts behind the percentage. Whether that satisfies a contract depends on the agreement’s own definitions; Jira only gives you the measured SLA.
Downloads for this guide
Free, no sign-up
- Blank monthly SLA summary
One row per client: period, SLA, target, counts, percentage, source, check date, notes.
 CSV · 1 KB
 - Filled example
The three organizations from this guide, January 2024, sample data.
CSV · 1 KB
How much work it is each month
One custom report, one series per organization
- Report
Set the month
Custom range, then read each percentage.
Once a month
- JQL
Check the counts
Resolved and breached for each client.
Two searches per client
- CSV
Export
All clients in one file, current view only.
Keep as a record
- Client
Write each summary
Split the numbers into one report per client.
By hand, per client
The report is an agent-side page: all clients are on one chart, it has no email schedule, and nothing goes to the customer automatically. With three clients a month you change the range, check three percentages with six searches, export, and write three summaries. With ten clients that is ten series to maintain, twenty searches and ten summaries, every month.
Before you send the numbers
- Each series uses the right organization and the same SLA metric.
- The range is the calendar month, not a rolling window.
- For every client, met ÷ resolved equals the report’s percentage.
- Each summary names the SLA, the period and the counts behind the percentage.
- The all-client chart stays internal; each client gets only their own numbers.
Common questions
Can Jira Service Management show an SLA report per customer organization?
Yes. Add one series per organization to a custom report and filter each series by organizations = "…". Each organization gets its own percentage for the selected range.
Can I put several clients on one SLA dashboard?
Yes, the custom report above is effectively an SLA dashboard for the team: all organizations on one chart. It is useful for comparing clients internally, but it is not a separate report for each client.
What should SLA reports for clients show besides the percentage?
The customer, the period, the SLA name, the target, and the counts behind the percentage (resolved, met, breached). With the counts, the client can see what the number means.
Is Jira Service Management SLA reporting automatic each month?
Not in the tested custom report. You change the range, check the numbers, export and write each client’s summary yourself. Jira Service Management SLA reporting is repeatable this way, but it stays manual.
What is the difference between a Jira SLA percentage and a contract?
Jira measures the SLA as it is configured in the service space. Your agreement may define the target, exclusions or the period differently. Check the SLA configuration against the agreement before you call the result compliance.
If you send these reports every month, Client Reporting Software for Jira Service Management prepares a separate PDF and CSV per customer organization on a saved schedule, and your team reviews and sends them. It is free for teams of up to 10 users.